
Trading Strategies: 9 Rule-Based Systems You Can Backtest
Short answer: A trading strategy is a written set of rules that says what you trade, when you enter, when you exit, how much you risk and when the rules run. The classic strategy types are trend following, breakouts, momentum, mean reversion and pullbacks, and each can be written as plain-English rules you can backtest. A strategy is only worth trading if it beats simply buying and holding after costs, on data it was not built on.
Last updated October 2026. We rewrote this guide to cover the classic strategy types, a pre-trade checklist and how to evaluate results. This guide is educational and is not financial advice.
What is a trading strategy, and what is a trading system?
A trading strategy is an idea about why price should move, turned into rules. "Buy strong stocks when they pull back in an uptrend" is an idea. "Buy when the close is above the 200-day average and the 2-day RSI is below 10" is a strategy.
A trading system is the whole machine around that strategy: the data, the schedule, the position sizing, the order types, the risk limits and the record keeping. Two traders can share a strategy and run very different systems. A system can be run by hand, but the more of it is written down and automated, the less it depends on how you feel that day.
The rule-based part matters because rules can be tested. Discretionary judgment cannot be backtested honestly, since you cannot un-know what happened next on an old chart.
What does every rule-based trading strategy need?
Start with one plain-English sentence describing the edge, for example "liquid US stocks in an uptrend tend to recover after short, sharp dips." Then fill in six components. If any one is missing, the strategy is not finished.
| Component | Question it answers | Example rule |
|---|---|---|
| Universe | What can it trade? | S&P 500 stocks with average daily dollar volume above a set minimum |
| Entry | When does it buy or sell short? | Buy at the close when price closes above the 20-day high |
| Exit | When does a winning or flat trade close? | Sell when price closes below the 10-day low, or after 30 days |
| Stop | Where is the idea wrong? | Exit if price falls 2 ATR below entry |
| Position size | How much per trade? | Risk 0.5% of equity between entry and stop |
| Schedule | When do the rules run? | Check signals once daily after the close; place orders for the next open |
The numbers in this article are examples to make the rules concrete, not recommended settings. For the risk side, see position sizing and algorithmic risk parameters.
What are the classic trading strategies, written as testable rules?
1. Trend following: moving average crossover
Rule: buy when the 50-day moving average crosses above the 200-day; sell when it crosses back below. Variants use price crossing a single average. Brock, Lakonishok and LeBaron found strong support for simple moving average rules on the Dow from 1897 to 1986, but a later data-snooping adjustment by Sullivan, Timmermann and White found the best rule's edge was not repeated out of sample. Expect many small losses in sideways markets.
2. Breakout
Rule: buy when the close exceeds the highest high of the last 20 days; exit when it closes below the lowest low of the last 10 days. Breakouts are often traded from chart patterns such as flags and triangles. See our breakout strategies guide and chart patterns cheat sheet.
3. Momentum
Rule: each month, rank the universe by its return over the past 12 months, buy the top 10%, and rebalance monthly. Jegadeesh and Titman documented that buying past winners and selling past losers produced significant positive returns over three- to twelve-month holding periods in their sample. A related version, time series momentum, looks only at each asset's own past return; Moskowitz, Ooi and Pedersen found it across 58 futures and forward contracts.
4. Mean reversion
Rule: buy when the close is more than 2 standard deviations below its 20-day average; sell when it returns to the average. Mean reversion bets that stretched prices snap back. Its main danger is buying something that keeps falling for a real reason, so it needs a stop or a time exit.
5. RSI(2)
Rule: only trade long when price is above its 200-day moving average; buy when the 2-period RSI drops below 10; sell when price closes above its 5-day moving average. This is Larry Connors' mean-reversion strategy as described by StockCharts, which notes Connors himself advised against stops. Test that choice explicitly rather than accepting it.
6. Pullback in a trend
Rule: if the 50-day average is above the 200-day, buy when price closes at a 5-day low; exit at a 5-day high or after 10 days. It combines trend following and mean reversion: follow the big trend, buy the small dip.
7. Opening range breakout
Rule: mark the high and low of the first 15 minutes after the 9:30 a.m. ET open; buy a break above the high, stop at the low, close the position by the end of the day. The idea is associated with Toby Crabel's 1990 book Day Trading With Short Term Price Patterns and Opening Range Breakout. Intraday costs and slippage matter a great deal here. See day trading for beginners and stock market hours.
8. Pairs trading (conceptually)
Rule: find two stocks whose normalized prices have historically moved together; when the gap between them widens beyond a set threshold, buy the laggard and short the leader; close when the gap closes. Gatev, Goetzmann and Rouwenhorst matched stocks by minimum distance in historical normalized price space and found the strategy profitable in their sample, but Do and Faff found profits declined over time. It also requires short selling, which adds cost and risk.
9. Buy and hold: the benchmark
Rule: buy the index fund and hold it. Every active strategy should be compared against this. It is a high bar: S&P Dow Jones Indices reports that 79% of active large-cap US equity funds underperformed the S&P 500 in 2025.
| Strategy type | Market it needs | Typical failure mode |
|---|---|---|
| Trend following / crossover | Long, persistent trends | Repeated whipsaws in sideways markets |
| Breakout | Expansion after quiet ranges | False breakouts |
| Momentum | Leadership that persists | Sharp reversals when leadership flips |
| Mean reversion / RSI(2) | Choppy, range-bound prices | Buying into a sustained decline |
| Pullback in trend | Uptrends with shallow dips | Dip turns into a trend change |
| Opening range breakout | Strong intraday direction | Costs and reversals after the open |
| Pairs trading | Stable relationships | The relationship breaks permanently |
How do you go beyond simple IF/ELSE rules without losing testability?
The earlier version of this guide made a point worth keeping: binary rules ignore context. A breakout in a calm, rising market is not the same trade as one during a volatility spike the day before a central bank decision. You can add context and still keep everything mechanical:
- Regime filter: only take long trades when the index is above its 200-day average.
- Volatility filter: skip or shrink trades when ATR is far above its own average.
- Liquidity filter: skip stocks below a minimum volume or with wide spreads.
- Event filter: no new entries the day before earnings or major economic releases.
- Graded sizing: count how many conditions are favorable and size in steps, such as a starter position when some are met and a full position when all are.
- Time stop: exit if the trade has not worked within a set number of bars.
Every filter is another parameter, so each one must earn its place in out-of-sample testing. Add them one at a time.
What should be on a pre-trade stock checklist?
A checklist turns your strategy into a routine you can follow under pressure. Before each trade, confirm:
- The stock is in your defined universe and meets your liquidity minimum.
- Every entry condition is met exactly, not "almost."
- The market regime matches what the strategy was tested in.
- No earnings, dividend or major economic release falls inside the expected holding period, unless the rules allow it.
- The stop level is set before entry and placed as an order where possible.
- Position size is calculated from the stop, so a loss costs the planned amount.
- Total open risk across positions stays under your portfolio limit.
- The spread and expected slippage are in line with what your backtest assumed.
- You know the exit rule and the time stop.
- The trade gets logged with the reason, the planned risk and the result.
For a version aimed at automated systems, see our automated trading checklist.
How do you evaluate a trading strategy?
- Include realistic costs. Commissions, spreads, slippage and, for shorts, borrow fees. High-turnover strategies can flip from profitable to unprofitable on costs alone.
- Compare with buy and hold. Use the same asset and period. If holding did better with less effort, the strategy has to justify itself on lower drawdowns or risk, not returns.
- Test out of sample. Build on one period, then test on data the rules never saw. Walk-forward testing repeats this across time.
- Count your attempts. Bailey, Borwein, López de Prado and Zhu showed that impressive backtests are easily achievable after trying a relatively small number of configurations. More variations tried means more skepticism needed. See overfitting in trading.
- Look at risk, not just return. Maximum drawdown, longest losing streak and risk-adjusted metrics such as Sharpe, Sortino and Calmar.
- Check the trade count. A strategy with a dozen trades tells you very little.
- Paper trade the exact rules. Paper trading catches execution problems a backtest cannot.
What trading tips actually help?
The useful tips are almost all about risk, because risk is the part you control:
- Know the base rate. In a study of Brazilian futures day traders who persisted for at least 300 days, 97% lost money. Assume the odds are against you until your testing says otherwise.
- Risk a small, fixed fraction per trade. Losing streaks are normal; sizing decides whether you survive them.
- Set a portfolio drawdown limit in advance at which you stop and review rather than trade harder.
- Change one thing at a time and retest, so you know what helped.
- Write the exit before the entry. Most damage comes from trades held past the point the idea was wrong.
- Review on a schedule, such as weekly, comparing live results with backtest expectations, not after every trade.
- Start small when going live, and scale only after live results look like the test.
Where Nvestiq fits
Nvestiq turns a strategy described in plain English, like any of the rules above, into exact logic through a deterministic compiler, never freeform code written by a language model. The backtest report shows what it made, what it cost to hold and whether to believe it, and flags when buy and hold beat your strategy. You can paper trade, run it live on your own broker, or export the strategy as code. Nvestiq supports US stocks, ETFs, crypto, futures, options, perpetuals and prediction markets, and is in early access ahead of launch.
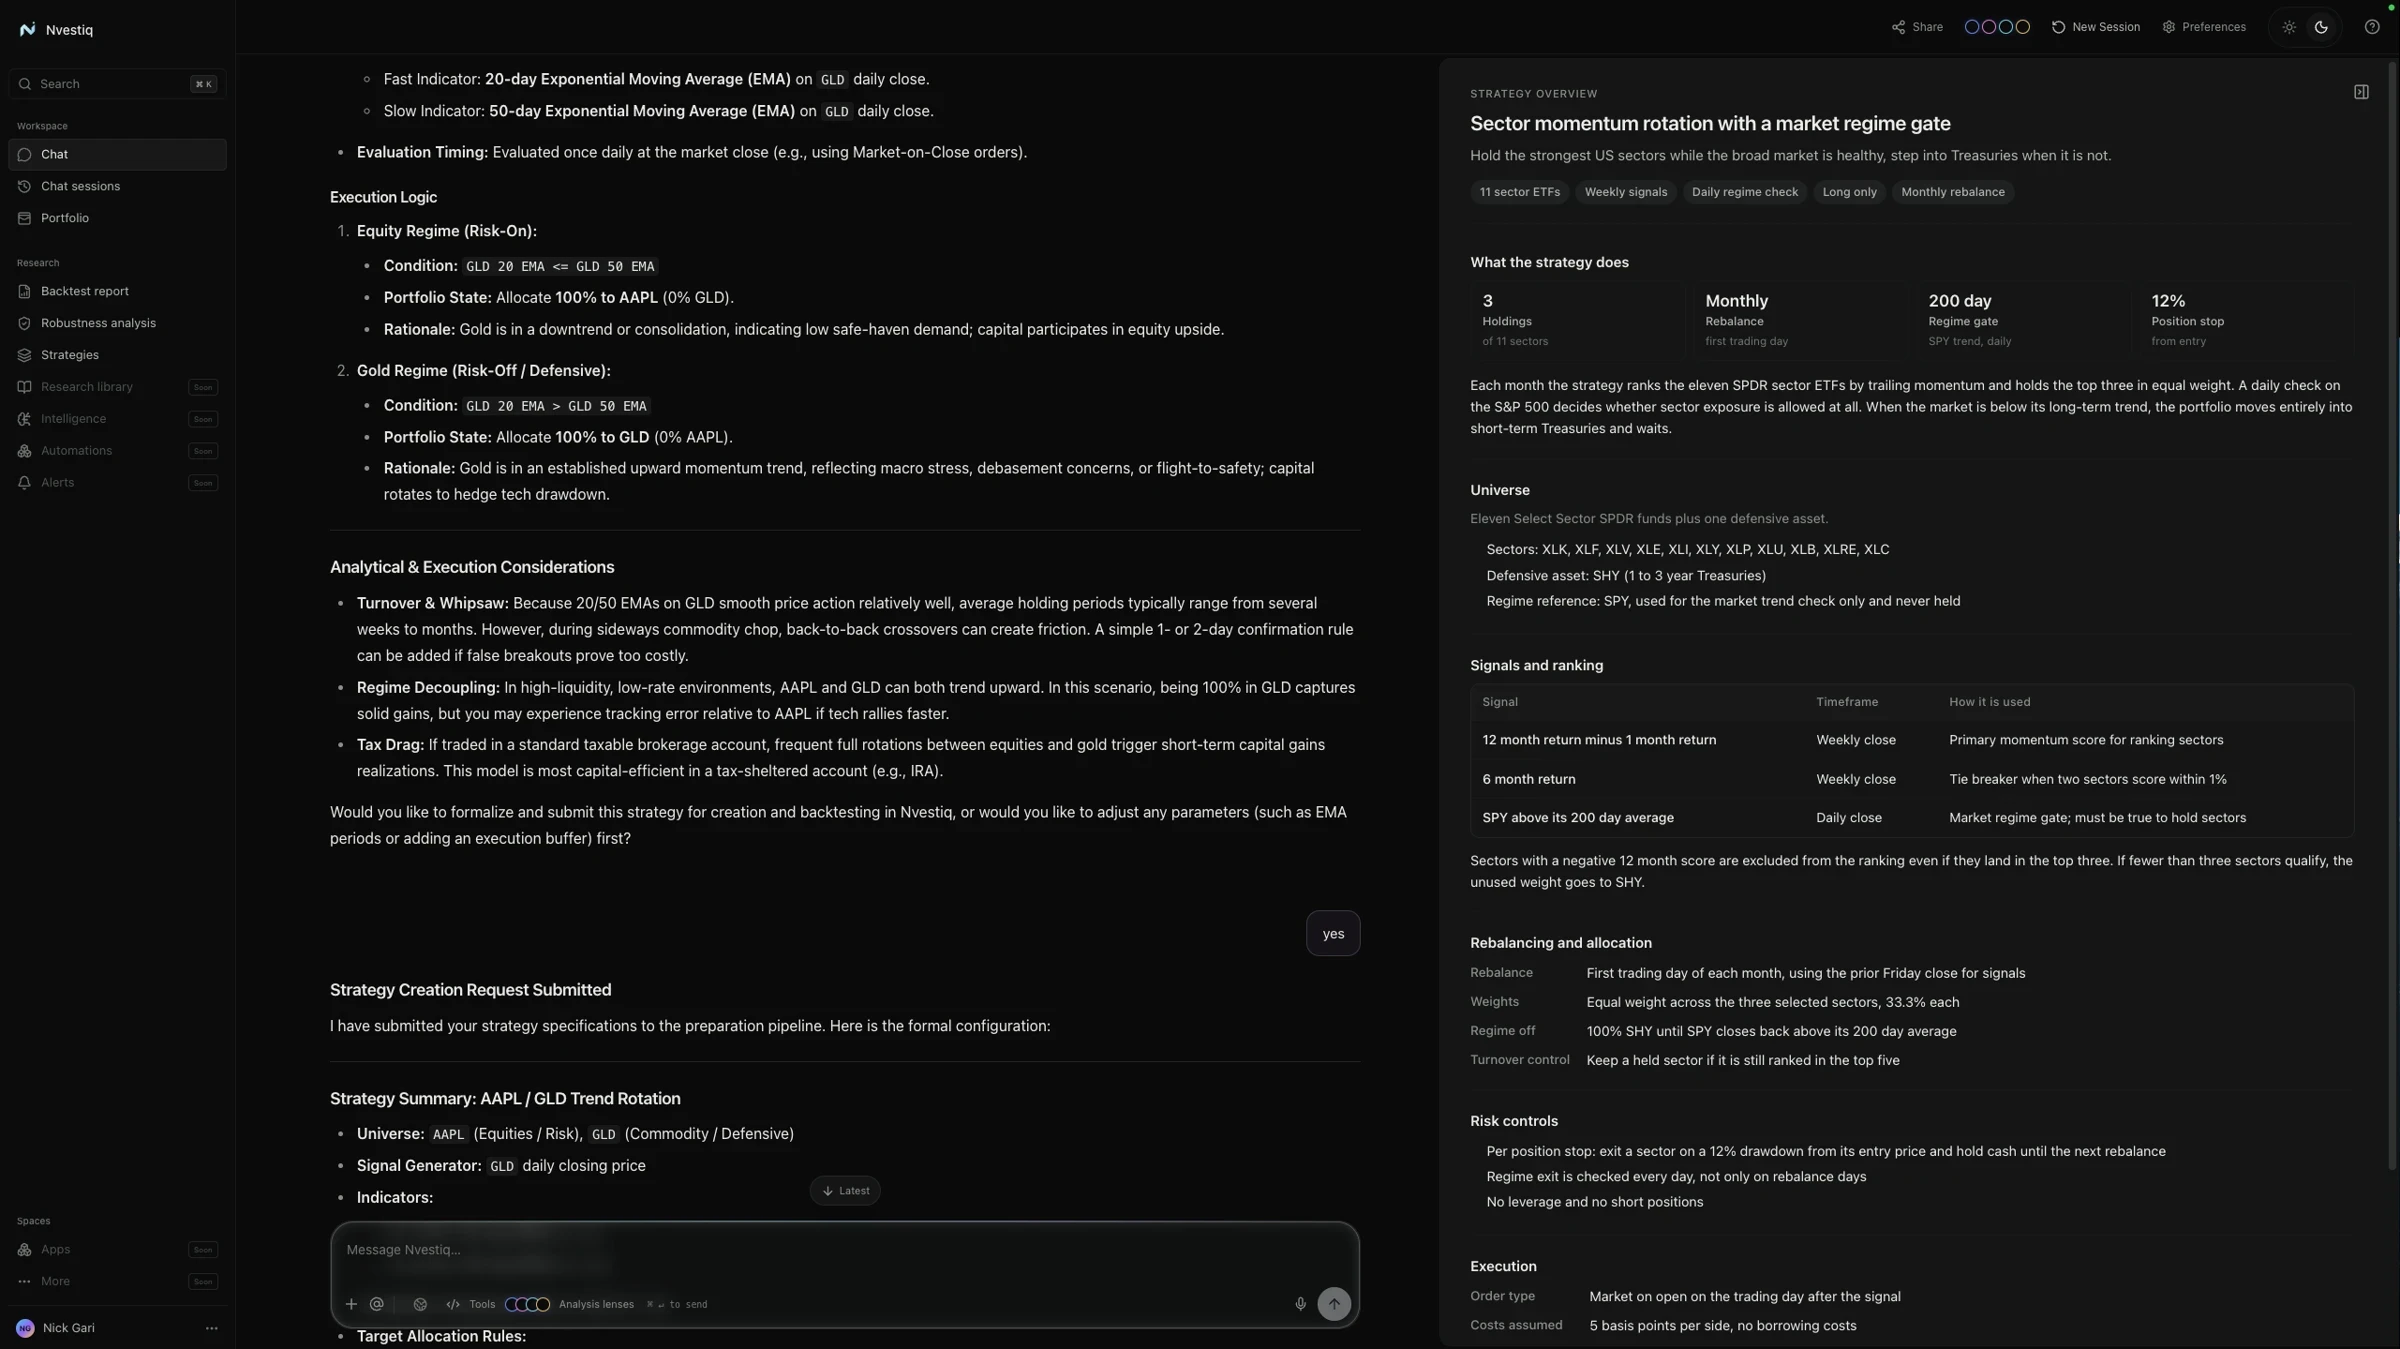
A strategy described in plain English in Nvestiq, with the Strategy Overview spelling out each rule before it is built. Example data.
Frequently Asked Questions
What is the best trading strategy?
There is no single best strategy. The best one for you has rules you can follow, fits your market and schedule, and survives realistic, out-of-sample testing against buy and hold.
What is the difference between a trading strategy and a trading system?
A strategy is the set of entry and exit rules. A system is everything that runs it: universe, sizing, risk limits, schedule, execution and record keeping.
What are the most common types of trading strategies?
Trend following, breakout, momentum, mean reversion, pullback in trend, opening range breakout and pairs trading, with buy and hold as the benchmark.
What is a rule-based trading strategy?
One where every decision, from what to trade to when to exit, is defined precisely enough that two people, or a computer, would make the same trade.
How many rules should a strategy have?
As few as possible. Each extra rule is another parameter that can be fitted to past noise. Add a rule only if it improves out-of-sample results.
What should be on a stock checklist before buying?
Universe and liquidity, entry conditions met exactly, market regime, upcoming events, stop level, position size, total open risk, expected costs and the exit plan.
Can I test a trading strategy without coding?
Yes. No-code tools let you describe rules and backtest them. Whatever tool you use, confirm the logic matches what you meant before trusting the results. See how to test an AI-generated trading strategy.
Risk Disclosure
Trading involves substantial risk of loss. Past performance and backtested results do not guarantee future results. Nvestiq provides technology tools, not financial advice.